NewAI insights and AI Vision, ready when you are →

The OEE platformbuilt for the AI era.

Start with real-time OEE, downtime and quality on every machine, live in days. Then switch on AI insights and AI Vision as you grow, on the same platform and the same data. No rip-and-replace, ever.

  • Live in days, not months
  • Works with your PLCs, cameras & ERP
  • AI-ready from day one
OEE Live
78.4%
2.15% vs last shift
Availability
91.2%
Performance
88.4%
Quality
97.6%
LIVEAI VisionCAM-02
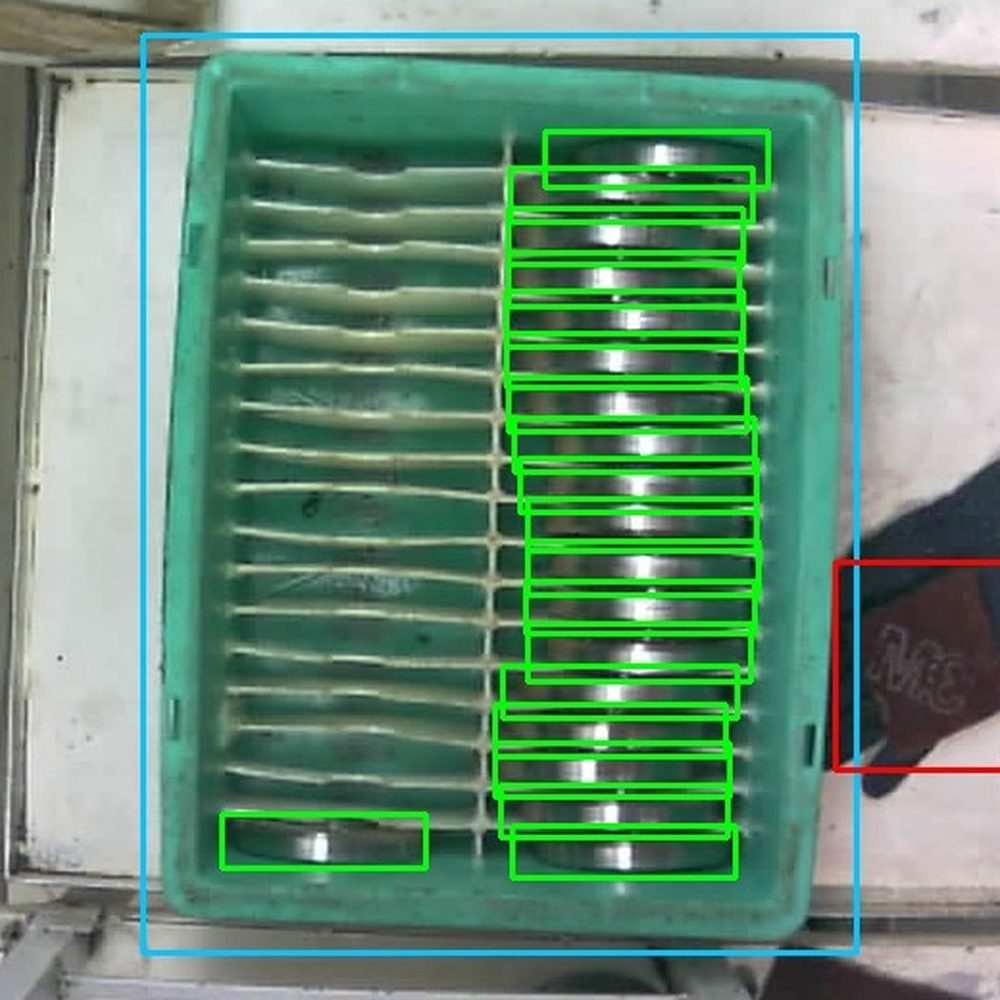
AI detecting gears in a crate
AI count · 18/36
1,184
Parts today
32
Crates today
OEE Breakdown
78.7%
OEE
  • 91.2%Availability
  • 88.4%Performance
  • 97.6%Quality
Downtime
Shift A · 06:00 – 14:0000:42:10
RunningPlannedUnplanned
Downtime by hour
0608101214
CNC-04
Apex Gears | GR-4021
ACTIVE
OEE
82%
Parts Ahead
18
Actual/Target
412/450
Rejects
0
Quality
Good parts this shift
97.6%0.8%
Good Parts
1,156
Rejected Parts
28
Alerts
  • Press-11STOP
    Die change · 4 min
  • IMM-07IDLE
    Material wait · 9 min
  • CNC-04ACTIVE
    Back to running
Hourly shift report
Shift_A_report.xlsxSent 11:00
HourActualTargetOEE
07–08525096%
08–09495094%
09–10555098%

Built for manufacturers who run on uptime

Precision AutoPolymouldApex ForgeNovaPackShree CastingsVega PharmaOrion PlasticsKaveri Foods
+0%

average OEE uplift in 90 days

−0%

unplanned downtime

0s

machine-to-screen refresh

0 hrs

of manual reporting saved per week

The hidden factory

Most plants run at 60% OEE. World class is 85%.

The gap isn't in the machines. It's in the minutes nobody sees: small stops, slow cycles, changeovers that run long, and rejects found too late.

Where a typical 8-hour shift goes

40% of planned time is lost

Illustrative · Six Big Losses

  • Good output
    60%
  • Breakdowns
    10%
  • Setup & changeover
    9%
  • Small stops
    8%
  • Slow cycles
    7%
  • Rejects & rework
    6%

Start with your problem

What are you trying to solve?

Pick the question that keeps you up at night. We'll show you the part of Zelar OEE that answers it.

The platform

One system, from shop floor to top floor.

Live plant dashboard

Every machine on one screen: running, idle or down, with OEE updating every few seconds. TV-wall mode for the shop floor.

Live · Shift ARunning 6Idle 1Stopped 1TV mode · auto-refresh 2s
Plant OEE▲ 0.0
76.4%
Availability▲ 0.4
88.5%
Performance▼ 0.3
88.7%
Quality▲ 0.6
98.0%
PRS-11Running
BR-118 · Bracket
61%
A72%
P87%
Q97%
Parts288 / 340
Last stop: Die change · 14 min
06:42PRS-11 stopped · die change06:44AI agent: PRS-11 changeovers cost ₹4.2 L this month06:51IMM-07 back to running07:02LTH-03 breakdown logged by operator07:15Shift A hourly report emailed07:20VMC-02 is 8 parts ahead of plan

Tap any machine for details · demo data

Manager view

A × P × Q, production, energy and cycle-time trends by machine, shift or day, plus plain-language insights.

avg OEE 73%
0608101214161820

Operator view

One machine, one job, one target. Operators see live count vs plan and flag issues in two taps.

412/450Behind

Downtime logging

Every stop is captured automatically. Operators tag the reason, so you finally know why.

Defect & rejection logging

Log every reject by reason in two taps. Quality % and the defect Pareto update instantly, so problems are fixed in the shift, not next morning.

Quality · this shift
98.2%
Rejects
21
  • Dimension out9
  • Burr6
  • Surface scratch4
  • Crack2
Tap + to log a reject

AI Vision inspectionPreview

A camera and a trained AI model check every part as it passes: good or defective, with the flaw boxed and logged in real time.

Tooth chip 97.4%
LIVECAM-03 · inspection
DEFECT · Tooth chip
1,284
Inspected
23
Defects
1.79%
Defect rate

Live camera feeds

Watch any machine live next to its OEE data, so you can check what really happened from anywhere.

LIVE10:21:37CNC-04 · OEE 82%

Reports & scheduled emails

Hourly shift Excel reports and daily summaries go out automatically to the right inbox.

XLS
Shift_A_hourly.xlsx
Every hour · 3 recipients

Shift planning

Plan shifts, breaks and jobs. OEE is measured against the plan, not a guess.

06:00 – 14:00Target 450
Production Planned break

AI insights

AI breaks losses into the Six Big Losses, flags machines at risk and ranks fixes by rupees recovered, so you always know what to do next.

Recovered per month₹4.2 L

Operator view

A screen your operators read from ten metres away.

The whole screen turns green, amber or red with the machine's state. Live count against target, hourly charts, OEE and downtime, and one big button to log a rejection. No training needed.

Auto-playing a shift · try it:
OP
SELECT MACHINE
HOB-07 · Gear hobbing
HOB-07
GEAR HOBBING · CELL 2
PROGRAM
P-2210
PROGRAM NAME
GEAR_HOB_2210
PART NUMBER
GR-2210
CUSTOMER
Demo Gears Co.
STD. DURATION
1m 10s
AVG. CYCLE
48s
● live · updated 0s ago
25m 23sACTIVEPRODUCTION DATETodaySHIFTShift A (07:00–19:00) Checked in
430
PARTS
418
EXPECTED
OK
429
NG
1
12 parts ahead
PRODUCTION PROGRESS
430 produced418 expected
Hourly utilization · 95%
Hourly parts · 430
0708091011121314151617
CYCLE TIMES
47s
LAST CYCLE
48s
AVERAGE
OEE
91%
94.1%
AVAIL.
97.3%
PERF.
99.8%
QUAL.
TOTAL DOWNTIMENOT CATEGORIZED
23m 55s4m 12s
Shift activity Shift A● ACTIVE
07:0010:0013:0016:0019:00

Recreated with demo data · press “Log rejection” or switch the machine state

AI use cases

Start with OEE. Grow into AI.

The AI runs on the same machine and camera data you collect from day one. Switch on each use case when you're ready, with no new hardware and no data migration.

Looking for AI Vision?See it on real footage, just below ↓

AI insights · 2 available today · 4 on the roadmap

Six Big Losses · last month₹11.1 L
Changeovers
₹4.2 L
Breakdowns
₹2.9 L
Small stops
₹2.0 L
Slow cycles
₹1.2 L
Rejects
₹0.8 L
Available

Loss breakdown with ₹ impact

Every lost minute is sorted into the Six Big Losses and priced, so you see where the money actually goes.

Changeovers on PRS-11 cost ₹4.2 L last month, 38% of all losses.

1IMM-07 feeder micro-stops+₹2.8 L
2PRS-11 die change (SMED)+₹2.1 L
3CNC-04 cycle program+₹1.2 L
Available

Ranked fix list

The AI ranks improvement actions by rupees recovered, so the team works on the biggest win first.

Fix the IMM-07 feeder micro-stops first: +₹2.8 L a month.

IMM-07 · cycle time● Stop risk 78%
— — alert threshold
Coming soon

Stop-risk alerts

Spots the early signs of a breakdown, such as drifting cycle times or rising micro-stops, before the machine stops.

IMM-07 is likely to stop in the next 2 hours. Cycle time is up 12%.

Why was OEE low on Shift B yesterday?
3 die changes on PRS-11 ran 40 min over plan. That cost 6.2 OEE points.
Coming soon

Ask your plant

Ask a question in plain language and get an answer built from your own production data.

“Why was OEE low on Shift B yesterday?” → 3 die changes ran 40 min over plan.

Shift A handoverauto-written · 18:55
  • ✓96% of target · 1,184 parts
  • ✓3 stops · 42 min downtime
  • !PRS-11 needs a die check
Coming soon

Auto shift handover

A short written summary of every shift, ready before the handover meeting starts.

Shift A: 96% of target, 3 stops, PRS-11 needs a die check.

CNC-04 · parts/hourSuggested 54/hr
▲ best shift 57/hr
Coming soon

Smart targets

Suggests realistic hourly targets for each machine and part, based on your best real shifts.

Target for GR-4021 on CNC-04: 54/hr (best shift: 57/hr).

AI Vision

Cameras that see what people miss.

Your existing IP cameras become sensors. Scroll to watch the AI work on real shop-floor footage: counting, checking quality and keeping people safe.

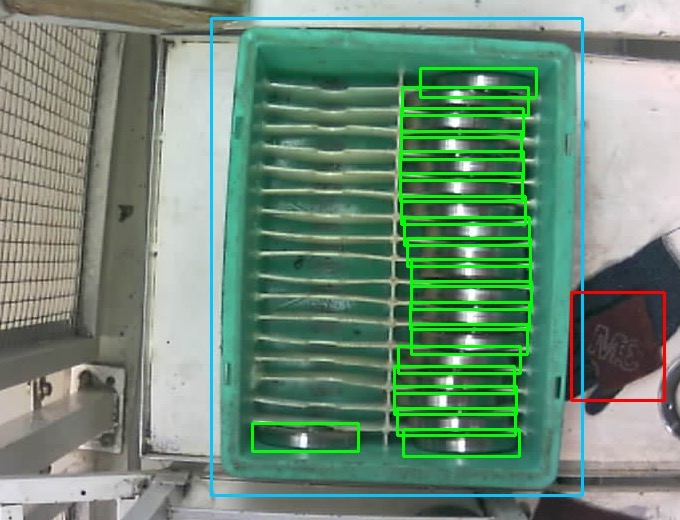
Overhead camera view of a crate of gears, each gear outlined by the AI model
LIVECAM-02 · Gear inspectionAI count · 18/36

Real frame from a live customer deployment

01 Available today

Part & crate counting

An overhead camera and a trained model count finished parts and full crates every 10 seconds, all shift. No manual tally, no missed crates.

Gear inspection table · 18/36 in crate · 1,184 parts today.

11:43:09 · 16 parts ✓
11:44:29 · 17 parts ✓
Stack of timestamped evidence photos from the counting camera11:45:49 · 18 parts ✓
LIVEEvidence log3 photos · last 60 s

Real frames from a live customer deployment

02 Available today

Photo proof for every count

Every count is saved with an evidence photo, parts outlined and number stamped. Disputes with customers or between shifts end in seconds.

11:44:29 · crate 1 · 18 parts · evidence photo saved.

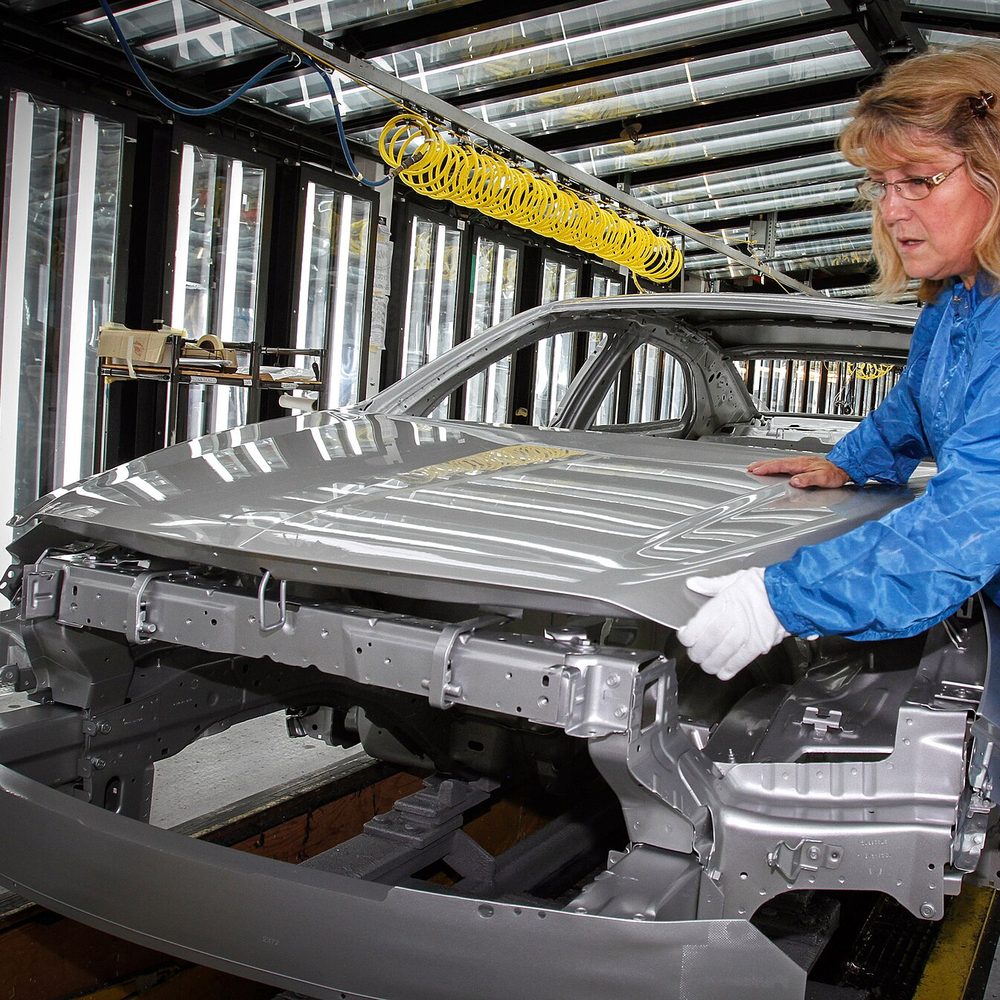
Inspector checking a car body on an assembly line
Surface dent 94%
Fit OK
LIVECAM-11 · Body shopInspecting body #A-2291

Photo: General Motors · CC BY 3.0 · Wikimedia Commons

03Coming soon

Visual defect detection

The camera checks every part and panel on the line and flags dents, scratches, chips and cracks before they reach the customer.

DEFECT · surface dent on hood · 94% · body held for rework.

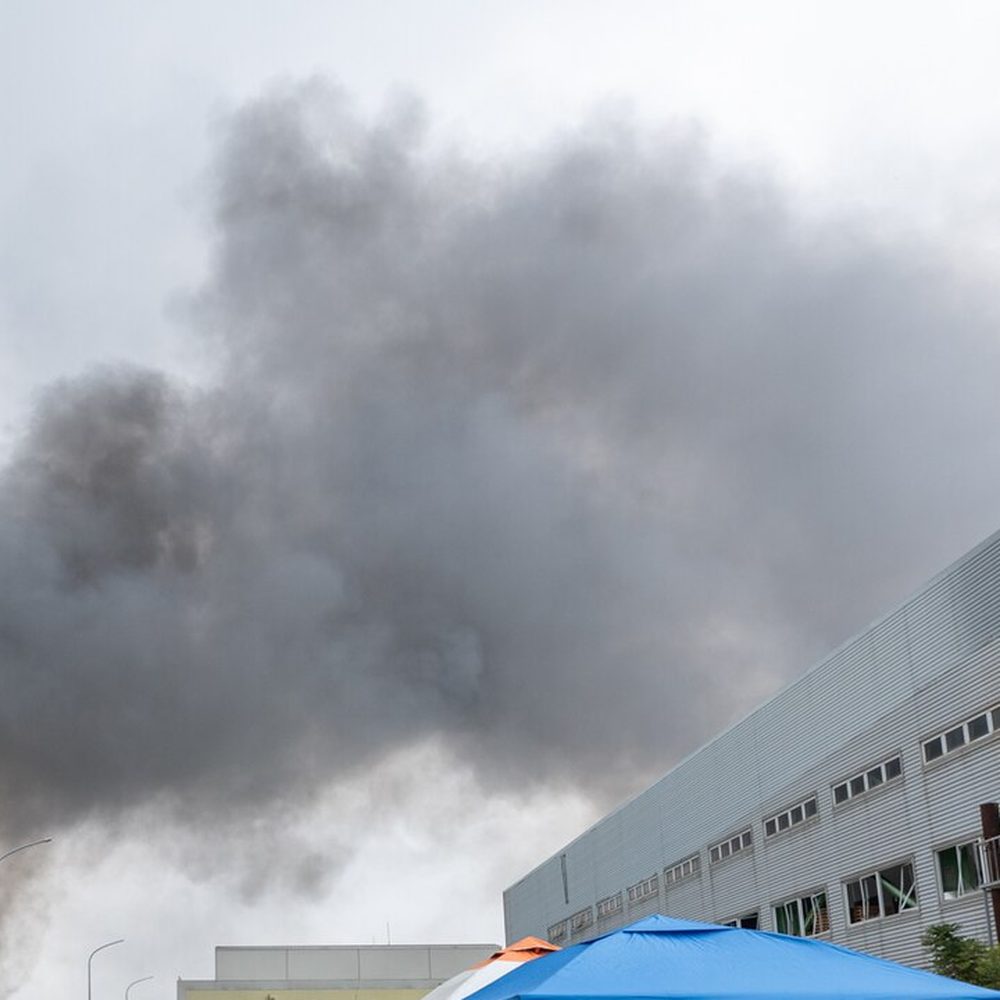
Thick smoke rising above a factory building
SMOKE 94%
LIVECAM-07 · Block C yard🔥 Alarm raised · 00:00:07

Photo: Office of the President, Taiwan · CC BY 2.0 · Wikimedia Commons

04Coming soon

Fire & smoke detection

Spots smoke and flames on any camera within seconds, often before a ceiling sensor reacts, and raises the alarm with the exact location.

SMOKE · Block C roof · 94% · alarm raised, safety officer called.

Worker in a yellow hard hat and safety glasses using a mitre saw without gloves
Hard hat ✓
Glasses ✓
No gloves
No gloves
LIVECAM-04 · Saw station 2PPE check · 2 of 4 OK

Photo: Sean McGrath · CC BY 2.0 · Wikimedia Commons

05Coming soon

PPE & safety checks

Checks hard hats, safety glasses and gloves at machines that need them, and alerts the supervisor the moment something is missing.

Saw station 2 · hard hat ✓ · glasses ✓ · gloves missing ✕.

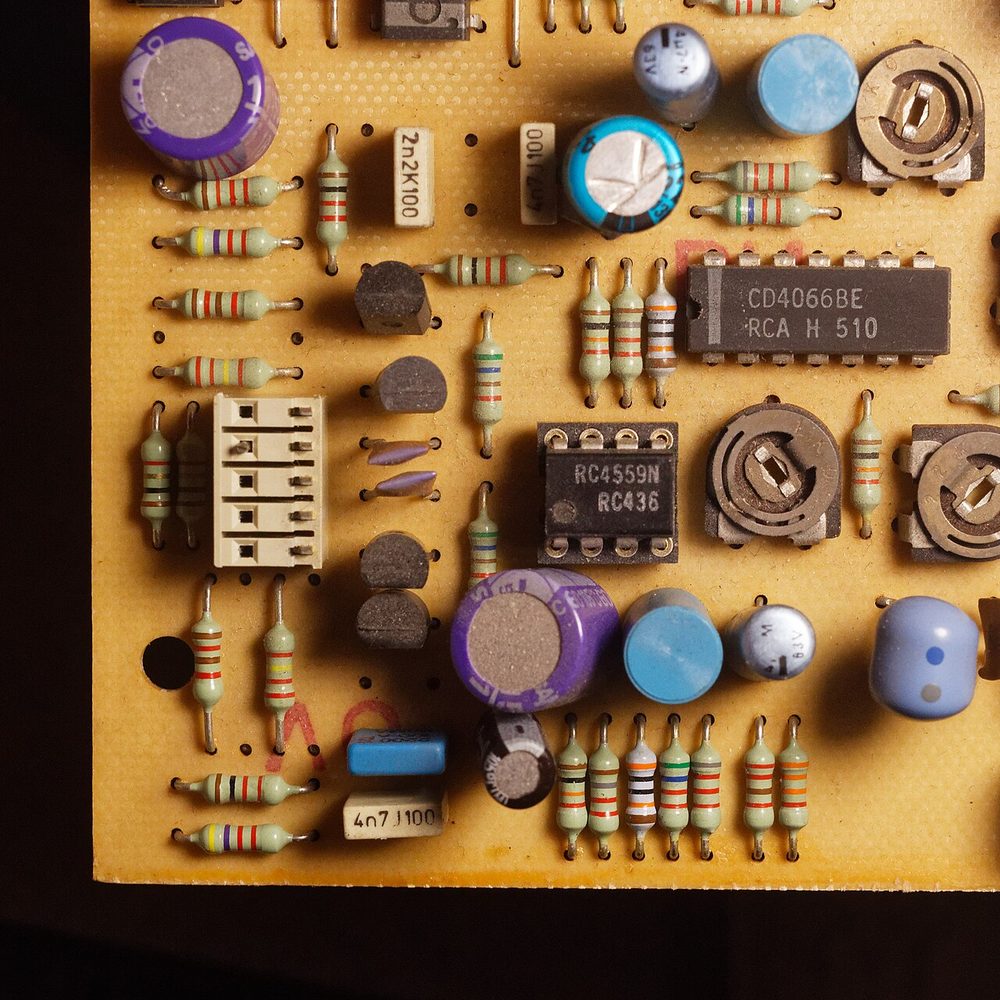
Close-up of a circuit board with chips, capacitors and resistors
U3 ✓
U5 ✓
C9 ✓
C14 missing
LIVECAM-09 · Board check41 / 42 components

Photo: CC0 · Wikimedia Commons

06Coming soon

Assembly verification

Confirms every component is present and in the right place before the part moves on, so a missing piece is caught at the station, not at the customer.

Board #B-118 · 41/42 components · C14 missing · flagged.

Also on the roadmapLabel & packaging checksOperator presence at stationSpill & leak detectionForklift zone alerts

ROI calculator

What is your hidden factory worth?

Move the sliders to match your plant. We'll estimate what low OEE costs you every month, and what a 10-point improvement is worth.

24
2
8
58%
₹3,500

Assumes 26 working days a month. “Output value per machine-hour” is what one machine produces in an hour running perfectly. This is an estimate, not a quote.

Lost to low OEE every month

₹0

9,984 planned machine-hours · running at 58% OEE

Recovered at +10 OEE points

₹0/ mo

That's per year

₹0

You · 58%World class · 85%

27 points between you and world class.

Get your free OEE assessment

How it works

From machine signal to decision in seconds.

No PLC rewrites, no rip-and-replace. A small gateway reads what your machines already know and sends it to the platform securely.

Machines & cameras
PLCs · Sensors · IP cameras
IIoT gateway
MQTT · OPC UA · Modbus
Secure cloud
Telemetry platform
Zelar OEE
OEE · AI agents · Vision
Your team
Email · Excel · ERP · TV
  1. 01

    Connect

    We fit a gateway to your existing machines. No PLC rewrites, no production stop.

  2. 02

    Monitor

    Live OEE, status and counts go up on every screen, from the operator's tablet to the TV wall.

  3. 03

    Analyze

    Downtime reasons, the Six Big Losses and AI insights show where the time goes.

  4. 04

    Improve

    Act on the biggest losses first, then track the gain shift by shift and month by month.

Integrations

Plugs into the tools you already run.

Production data flows out to your ERP, BI dashboards and team chat, so OEE becomes part of how the whole business plans, not another screen to check.

Zelar OEE
Machines · Cameras · AI

Launch

6 tools

Included from day one

  • REST APIAPI
  • WebhooksAPI
  • Excel logoExcelFiles
  • CSVFiles
  • EmailAlerts
  • SFTPFiles

Growth

6 tools

ERP, BI and team chat

  • SAP logoSAPERP
  • Odoo logoOdooERP
  • Dynamics 365 logoDynamics 365ERP
  • Power BI logoPower BIBI
  • Microsoft Teams logoMicrosoft TeamsChat
  • WhatsApp logoWhatsAppChat

Enterprise

4 tools

Enterprise systems and data

  • Oracle logoOracleERP
  • Salesforce logoSalesforceCRM
  • IBM Maximo logoIBM MaximoMaintenance
  • SQL Server logoSQL ServerDatabase

Need something else? The REST API and webhooks connect to almost anything. Names shown are trademarks of their owners.

Industries

Built for discrete and batch manufacturing, wherever uptime pays the bills.

  • 01

    Automotive & auto parts

    Press, machining & assembly lines

  • 02

    Plastics & moulding

    Injection & blow moulding cells

  • 03

    Food & beverage

    Filling, packing & batch lines

  • 04

    Pharma & life sciences

    Compression, coating & packing

  • 05

    Packaging & printing

    Converting & print presses

  • 06

    Metal & fabrication

    Forging, casting & CNC

Proof over promise

Trusted numbers. Measurable results.

Secure by design

Role-based access for operators, supervisors and managers. Encrypted sessions, and your data stays yours.

Built for the floor

Installable app that keeps working on patchy Wi-Fi, a TV-wall mode, and big, glove-friendly controls.

Numbers you can defend

OEE follows the standard Availability × Performance × Quality formula and is checked against reference data.

+21%OEE in one quarter
“For the first time, my supervisors and I argue about solutions instead of about whose numbers are right.”
Plant Head
Auto components manufacturer
−40%changeover time
“The downtime Pareto showed us our changeovers were the real problem, not the machines.”
Production Manager
Plastics moulding unit
6 hrssaved every week
“Shift reports used to take all morning. Now they're in my inbox before the shift meeting.”
Operations Lead
Packaging plant

FAQ

Questions, answered.

Something else on your mind? Talk to us.

  • Overall Equipment Effectiveness is the share of planned production time that is truly productive. It multiplies Availability (was it running?), Performance (was it running at full speed?) and Quality (were the parts good?). 100% means only good parts, as fast as possible, with no stops.

Ready to see your OEE in real time?

Book a 30-minute walkthrough. We'll show you the platform running on live machine data and map out a pilot for your plant.

  • 30-minute live walkthrough
  • Pilot plan for one line
  • No commitment

We'll reply within one business day. Your details are only used to arrange the demo.